
Boston Is the Fourth-Most Traffic-Congested City on the Entire Planet
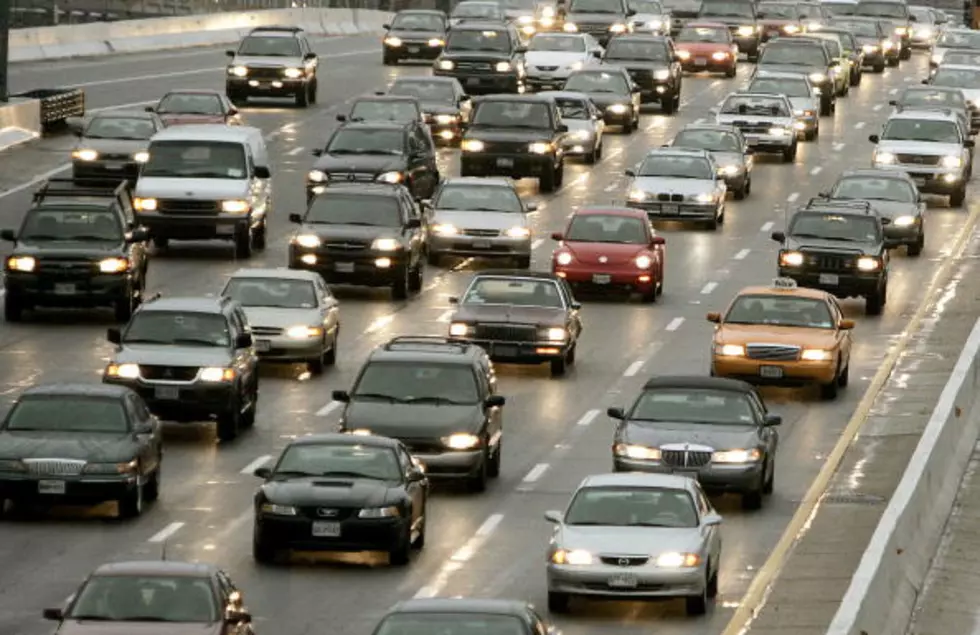
You only thought commuting into Boston was hell on wheels, but the latest INRIX 2022 Global Traffic Scorecard confirms it. According to the study, Boston has the fourth-highest traffic delay times in the world.
Only London, Chicago, and Paris surpass Boston with higher annual traffic delay times. It's 156 hours in London, 155 hours in Chicago, 138 hours in Paris, and 134 hours in Boston.
The report is fascinating.
According to INRIX, "Traffic congestion occurs when demand for roadway travel exceeds the supply of roads. As vehicular traffic builds, drivers, freight movers, and bus riders lose time and spend fuel unproductively."
The INRIX report stated "that 'lost time' has a value," which is analyzed in the 2022 Global Traffic Scorecard.


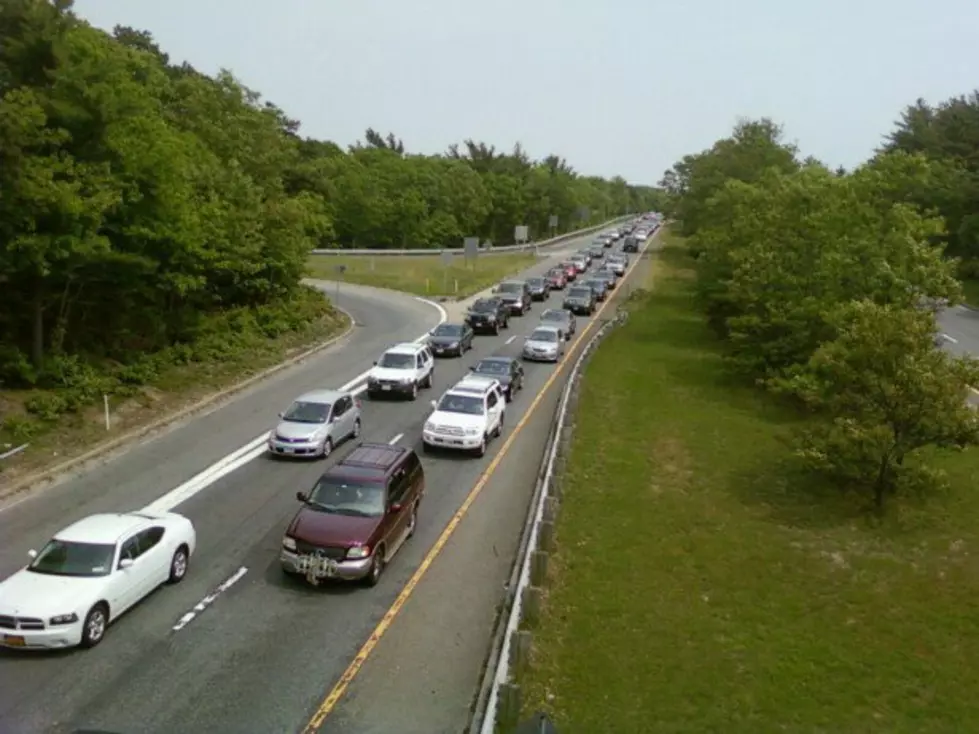
According to the Boston Herald, the 2022 Global Traffic Scorecard examined the worst traffic corridors and found that "Boston's I-93 southbound was only outranked by Stamford, Connecticut's I-95 northbound, LA's I-5 southbound, and the most congested, Stamford's I-95 southbound, which resulted in 34.5 minutes lost on average per day at its 8 a.m. peak commuting hour."
The INRIX report found that "on average, Americans spent $129 more at the gas pump to commute last year but much more if they commuted to work in LA or Chicago."
INRIX said drivers commuting in major cities such as Chicago ($2,681), Boston ($2,270), and New York City ($1,976) spent a lot more money. The report says congestion cost the city of Boston $4.3 billion last year.
INRIX said a return to public transportation could help some, though according to the Boston Herald, ridership remains "much lower than pre-COVID levels in the U.S."
See the Must-Drive Roads in Every State
Gallery Credit: Sarah Jones
LOOK: See how much gasoline cost the year you started driving
Gallery Credit: Sophia Crisafulli
More From WFHN-FM/FUN 107


